
Azurity Pharmaceuticals — Healthcare
Modern reporting, built right into ACE.
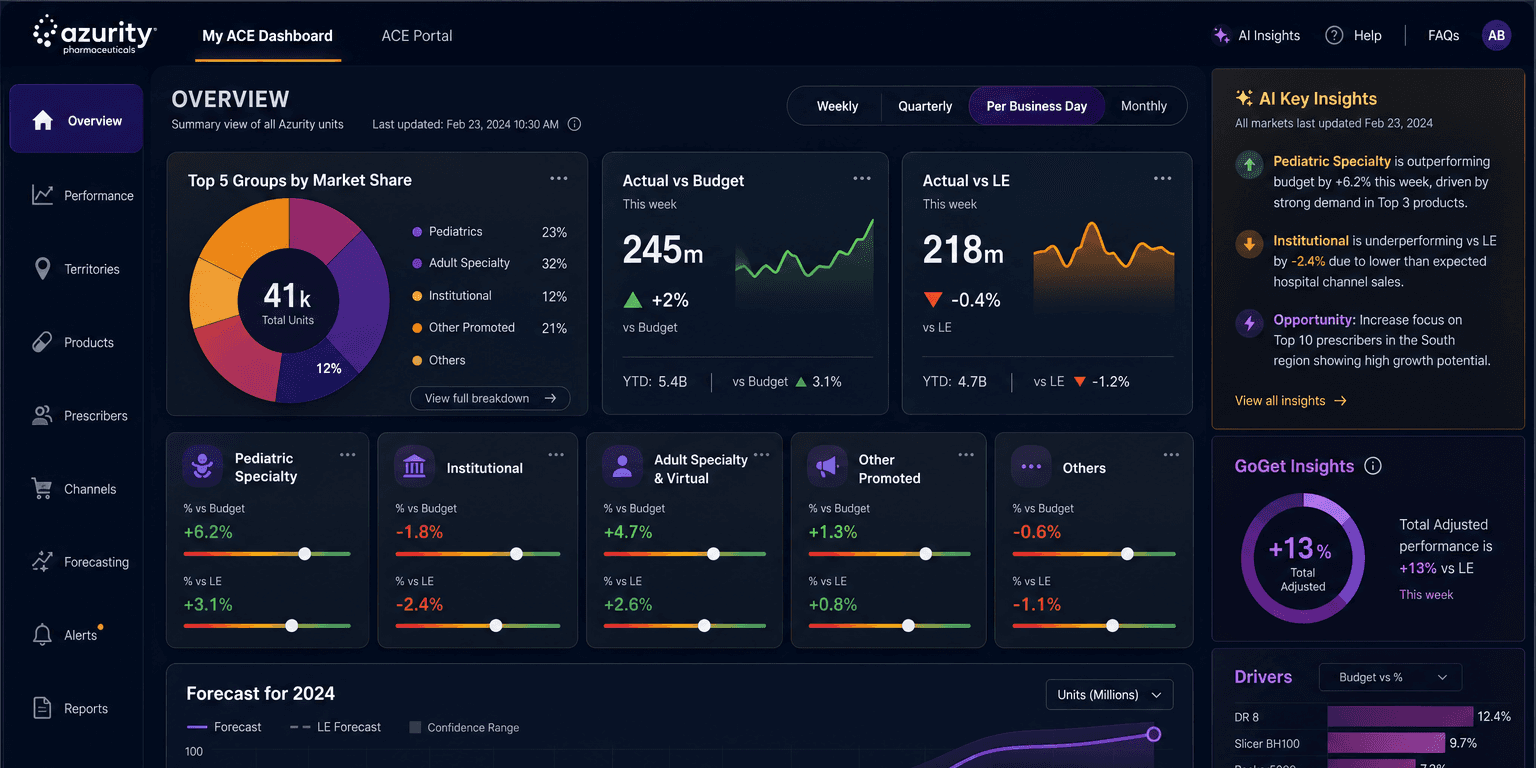
Azurity needed its internal ACE platform to natively support live Tableau and Power BI reporting. We implemented and re-skinned Interwork's Curator CMS, mapped the experience to five commercial personas, and replaced a manual Excel wholesaler report with a standardized, on-brand analytics template.
/ 01 — The Challenge
A homegrown platform outgrowing manual reporting.
Azurity Pharmaceuticals runs ACE, an internal web application built to help commercial teams track performance. ACE needed to coexist seamlessly with Power BI reporting, but the team's core analytics artifact — a Weekly Wholesaler Report tracking unit sales across every specialty and brand — still lived in a manually maintained Excel workbook with no standard template or brand guide.
As one Azurity stakeholder put it: years of relying on out-of-date analytics and a traditional reporting approach had become a real bottleneck to fast, confident decision-making.
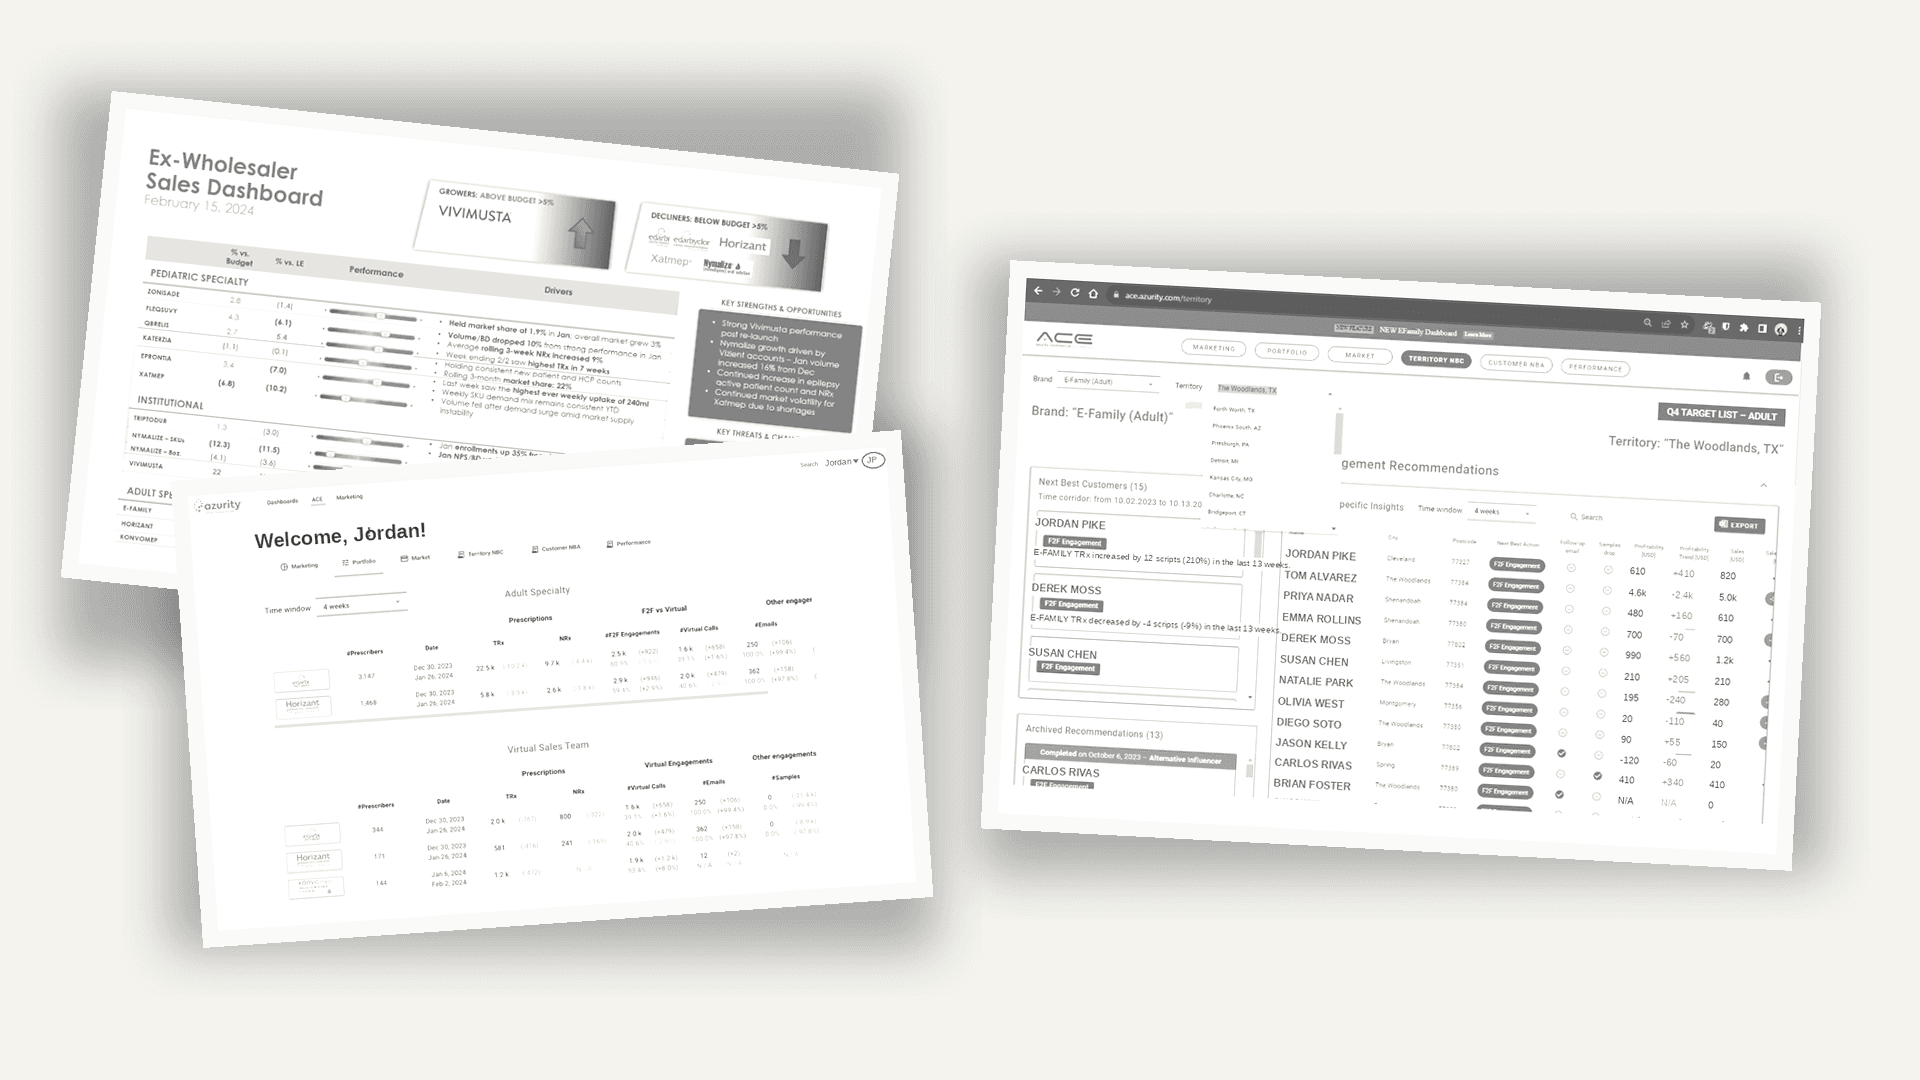
Figure 1 — the legacy Weekly Wholesaler Report and ACE screens before redesign
/ 02 — The Approach
Curator CMS, rebuilt around real people.
We implemented Interwork's Curator platform — a CMS purpose-built for embedding Tableau and Power BI visualizations — inside a live test environment, then rebuilt its interface to match Azurity's brand standards.
- Mapped user journeys across five commercial personas — Sales Rep, Marketer, Sales Leader, Brand Lead, and Commercial Leadership (CCO / CLT / BoD) — to prioritize what each role needed to see first.
- Designed a Summary/Homepage view rolling up all Azurity units, with drill-through by specialty into individual brands, plus WoW and YoY comparisons against Budget and Latest Estimate.
- Wrote a Curator CMS best-practices guide covering when to spin up a new page versus embed content on an existing one, so Azurity's team can manage the platform independently going forward.
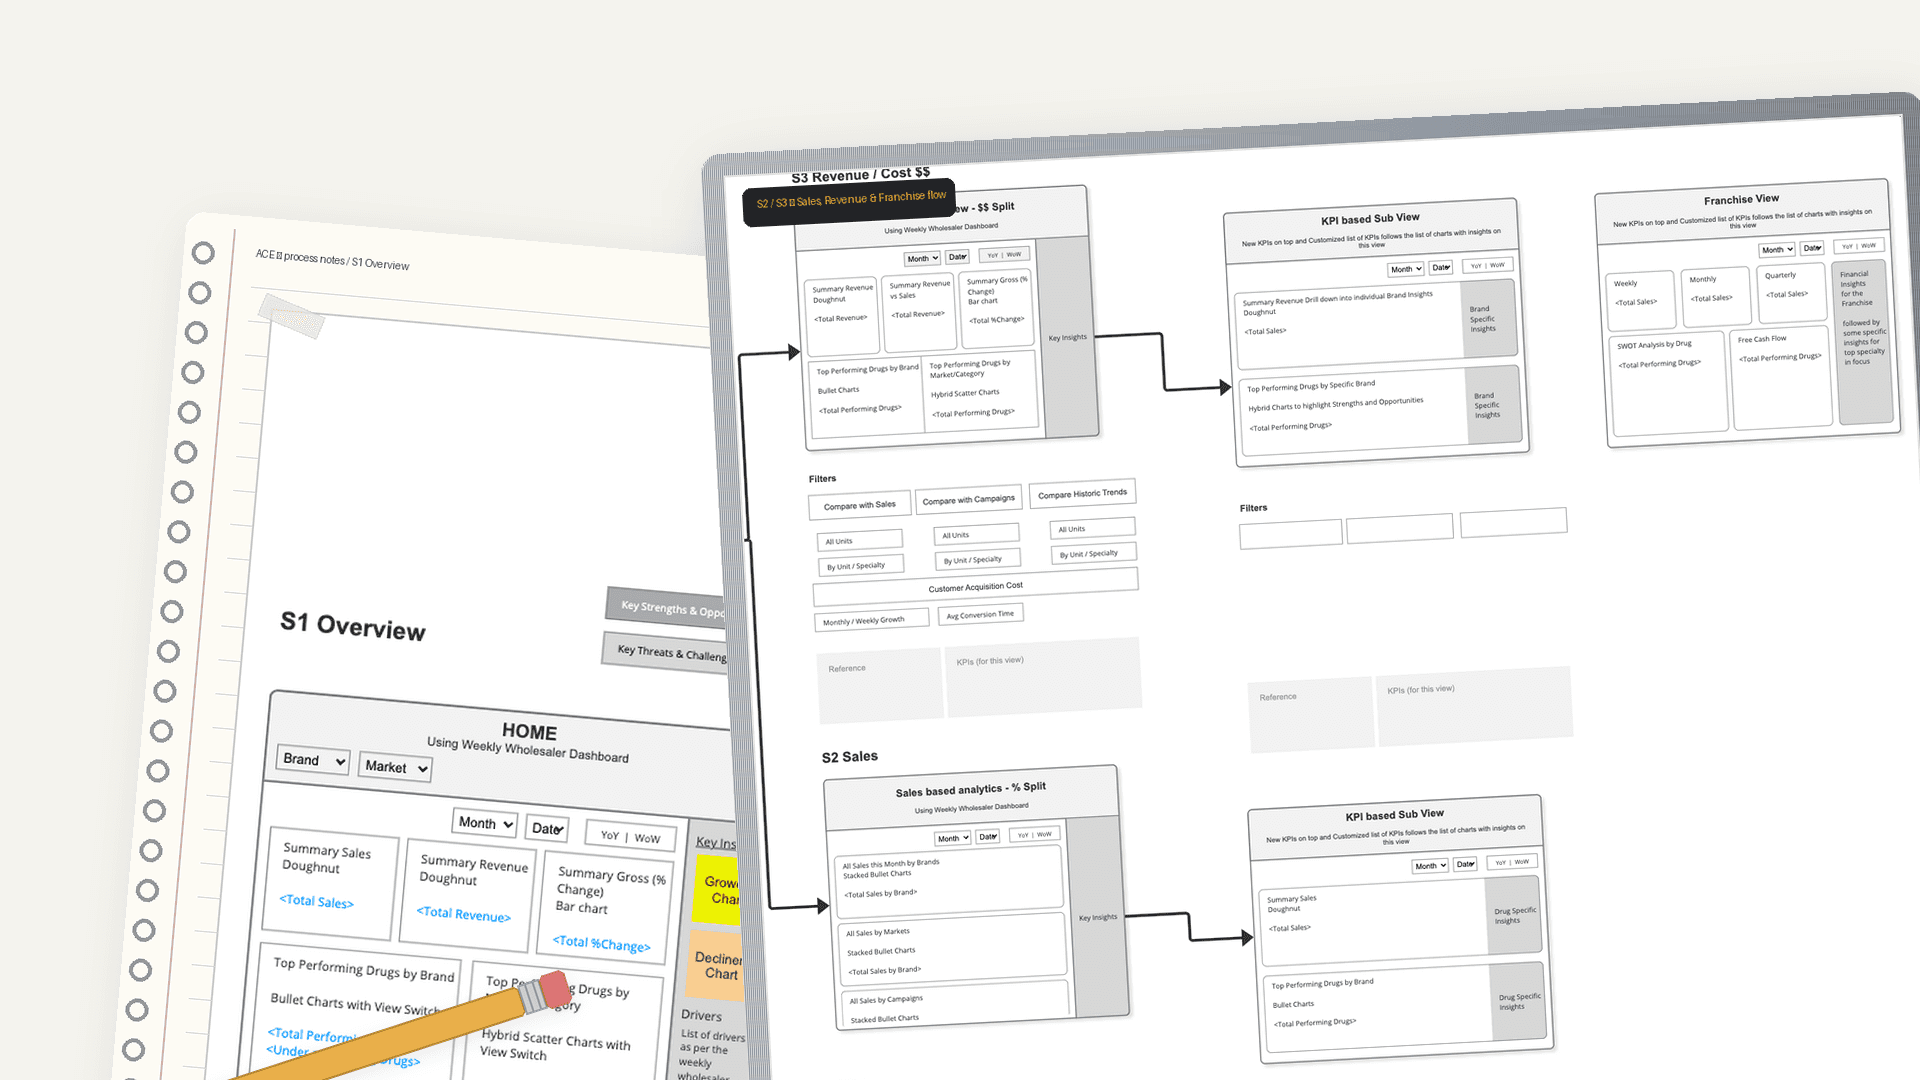
Process storyboard — the Overview wireframe and the Sales/Revenue/KPI/Franchise flow mapped before visual design
“We've had years worth of struggle with tracking analytics due to out of date analytics and traditional approach. The live tracking insights and forecasting based system was a perfect solution we were looking for.”
/ 03 — The Solution
A live, on-brand analytics home for ACE.
The finished experience gives Azurity a Trends view alongside the Summary — a metrics table (Prior, Actual, Budget, Performance vs. Budget) with WoW and YoY trend lines, indexed color coding for above/below-budget performance, a forecast line, and a running YTD Actual vs. YTD Budget total. We also redesigned the Weekly Wholesaler Report itself into a standardized, on-brand template and companion guide for every future report.
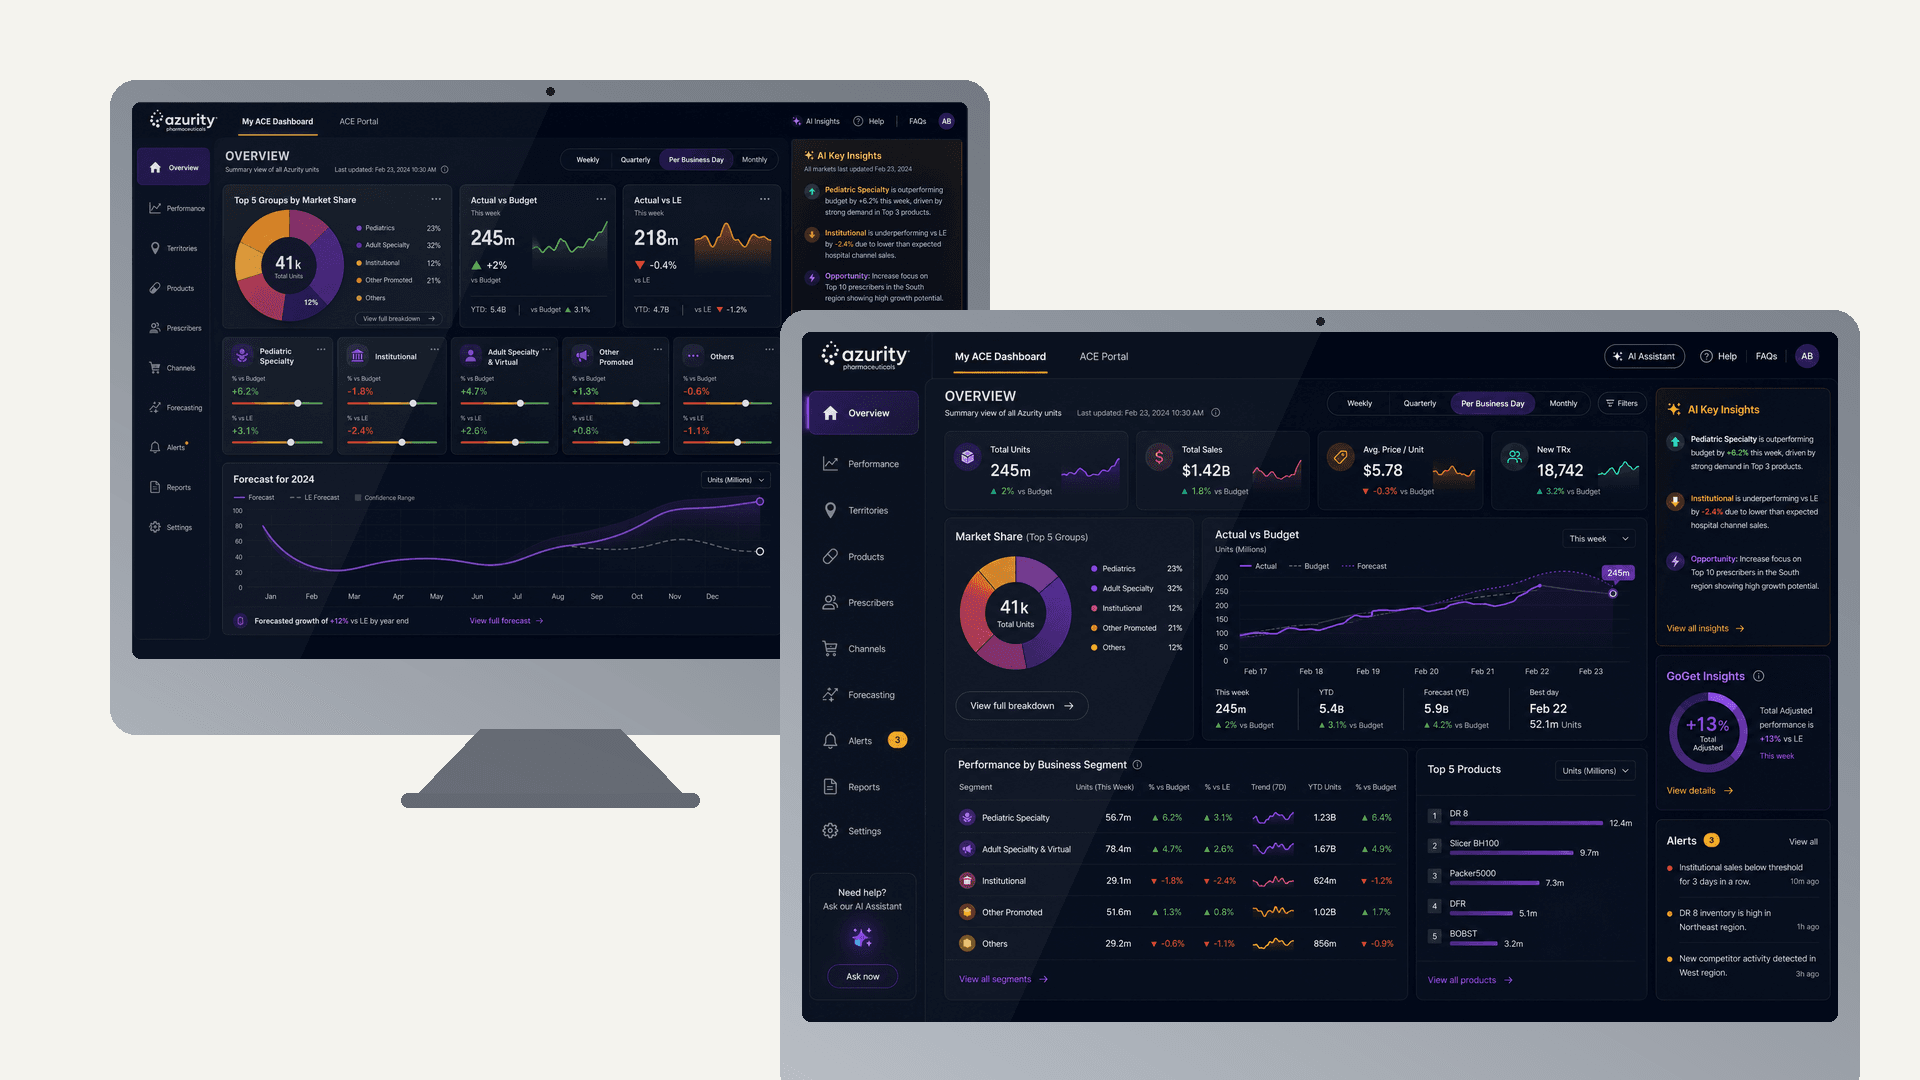
Figure 2 — the redesigned ACE Overview, shown across two screen states
/ 04 — The Results
The numbers that moved.
- Shipped to production, unlocking a wave of new product modifications built directly on the platform.
- Helped secure new funding by giving leadership a credible, live view of performance.
- Established the foundation for a new product now in user testing.
Want results like these?
Book a free 30-minute discovery call. No pressure. Just ideas.
Book a Call